DRAWING A CHART/TABLE
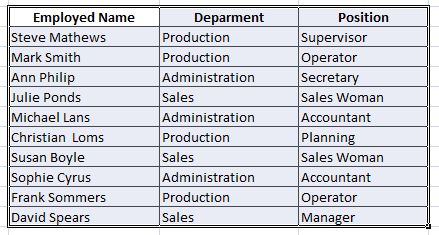
Now, we have all the information in our payroll, with its attributes in Bold and centred.
Now, we will learn how to draw a table around the data we have.
We shade the area in which we want to draw the table, which means, all the information we have written. How do we shade an area?
We place the cursor over the point where we want to begin shading. In this case, over cell C2. By clicking and keeping the left button of our mouse pressed, we move the mouse to capture all the information.
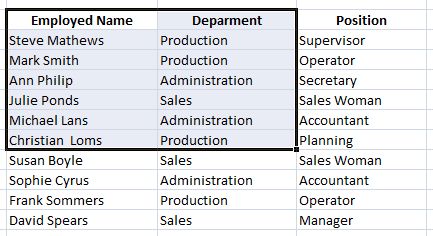
In the previous image, we can see how little by little the desired area is being shaded.
Once we have shaded all the information up to cell E12, we look for the draw borders option on the Font option in the Home tab of the Toolbar.
Home tab: 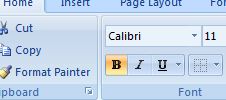
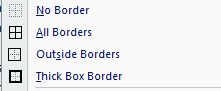
Draw borders option: 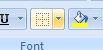
We open the options by clicking on the arrow. We will see every alternative we have for borders. In this case, we will choose the option to draw All borders.
Now our payroll is in the form of a table with all its borders properly drawn.