BALANCE IN THE CONSUMER MARKET
Now we have analysed the different components
in the demand of goods and services we can draw its curve. When
drawing the curve, we need to bear in mind, that there is a relationship
between the demand of goods and production.

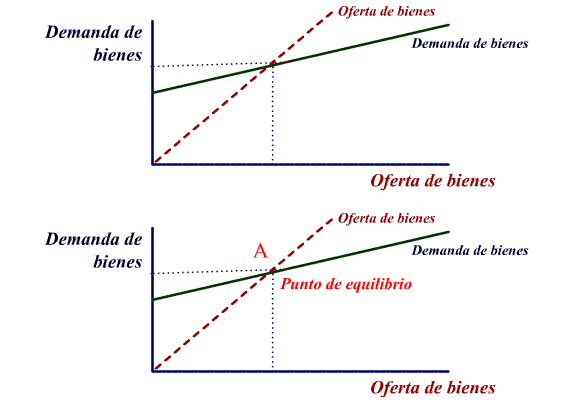
The Y axis = Demand for Goods
The X axis = Offer of Goods
Offer Goods = 
Demand for Goods = 
A = Point of Balance
The slope is positive because, as we have seen,
various components (consumption, investment, public expense) are
positively related to the level of income.
I have drawn a line from the origin and which
has an angle of 45%: the points of this line fulfill the condition
that we have fixed of which the offer is the same as the demand.
If the quantity demanded is 1.000
million euros (vertical axis), the production offered will also
be 1.000 million euros (horizontal axis), no more no less.
The point at which both lines cross ("A")
is the point of balance in the economy:
The quantity demanded is equal to
the quantity offered: there is nothing else to buy, and nothing
else to sell.
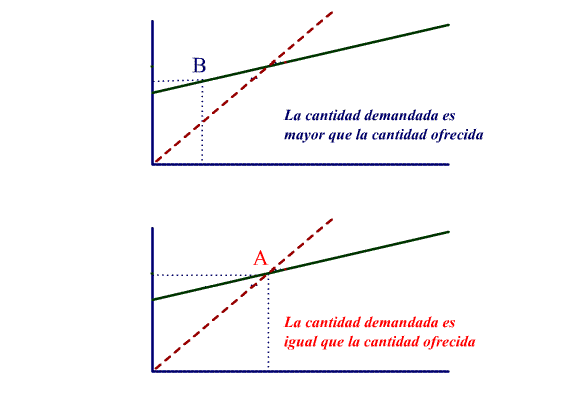
If the economy finds itself in point ("B") in
which the quantity demanded is greater than the quantity offered,
there is insufficient demand (there will be people that can not
buy what they want) which will mean that companies will increase
their production until OA = DA

A = The quantity demanded equals the quantity offered
B = The quantity demanded is greater than the amount offered
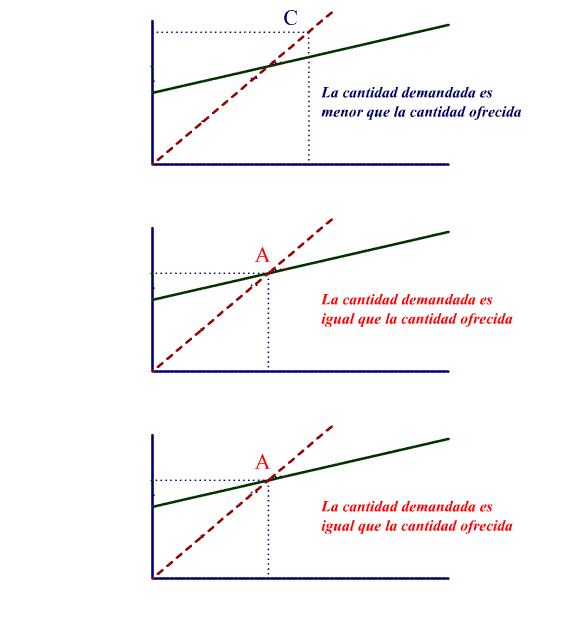
If, on the contrary, the quantity demanded is less than
what is offered (point "C"), there will be products
that will not be sold which will cause companies to reduce their
production until OA = DA

A = The quantity demanded equals the quantity offered
C = The quantity demanded is less than the amount offered

