CREATING GRAPHICS
To create Graphics in Word, we have to follow these steps:
1. We click on the Insert tab in our toolbar.

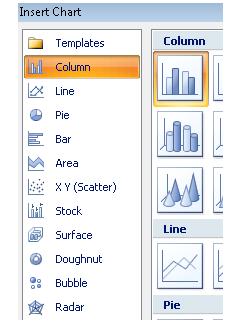
2. We look for and click on the Chart icon.

3. This will open a window with the different types of pre-designed graphics Word possesses
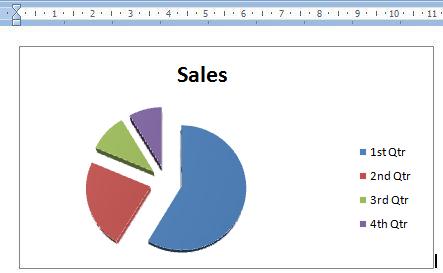
4. Once we have selected the type of graphic, a graphic with base information will be inserted in our worksheet. In this case, we have selected a pie chart.
5. Simultaneously, an Excel worksheet will open showing the basic information upon which our graph was formed.
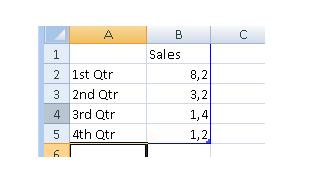
6. In this Excel worksheet, we can update the information we need for the graphic. In this example, we have used Sales information for each one of the four quarters.
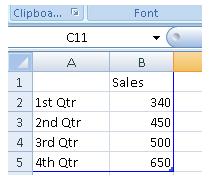
7. Once the information has been updated in our Excel worksheet, the new information will appear in the graph inserted in our worksheet.

