MORE ABOUT GRAPHICS
Once we have done our graph, we can edit it to match what we want to present.
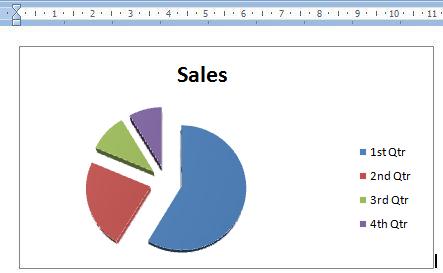
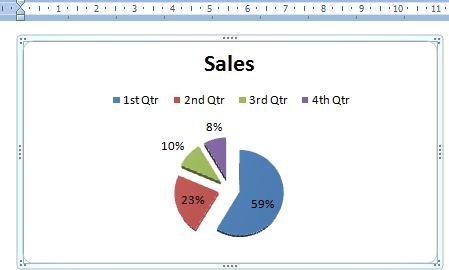
Let's take the graph we did in the previous lesson as an example:
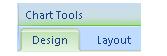
If you notice, a new tab called the Chart Tools appeared in our toolbar. In it, we will find the options needed to edit our graph.
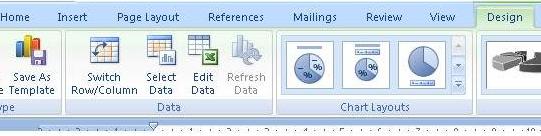
For example, if we want to change the design of our graph, we need to click in the corresponding tab in the toolbar: Design.
And locate the area called Chart Layouts. Here, we will find the options we have for the type of graph we are using.
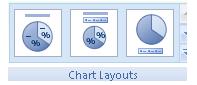
We select one of these options. For example, we selected the one with the percentage values shown in the graph image.

In the worksheet, we can see the new changes we have included. Notice that the percentages are shown in each of the quarters.
If we want to edit the information, either because we made a mistake or simply because we want to update the information, we need to click on the Edit Data icon. This will open the Excel worksheet with which the graph was made and we can edit the information.


